如何更改Django默认主页为自定义主页,更改Djago默认主页为自定义主页,这是开始网页的第一步。......
python如何在matplotlib中绘制图例legend
来源:互联网
2023-03-16 19:29:23 410
matplotlib 是Python的可视化包与工具,可视化必然涉及到图例这一块,图例的英文乘法:legend, 用于区分不同的形状:

工具/原料
- Anaconda3.exe
方法/步骤
首先导入使用到的包,matplotlib.pyplot, numpy:

接着设置图的大小,添加子图,figsize用于设置图的大小:

再接着,我们使用numpy创建正弦,余弦曲线的点集合,并调用plot方法绘制:

然后,我们只需要一行代码,plt.legend(loc='位置'), 把图例加上了:

但是,我们可能满足于这种显示方式,我想要把图例单独单个显示,拆分出来,这里重要的代码就是,获取到legend ,调用add_artist方法,不然会被覆盖掉,到此,legend图例的操作完成了。

一个好看的图例:

源码
# 导入matplotlib.pyplot, numpy 包
import numpy as np
import matplotlib.pyplot as plt
# 添加主题样式
plt.style.use('mystyle')
# 设置图的大小,添加子图
fig = plt.figure(figsize=(5,5))
ax = fig.add_subplot(111)
#绘制sin, cos
x = np.arange(-np.pi, np.pi, np.pi / 100)
y1 = np.sin(x)
y2 = np.cos(x)
sin, = ax.plot(x, y1, color='red', label='sin')
cos, = ax.plot(x, y2, color='blue', label='cos')
ax.set_ylim([-1.2, 1.2])
# 第二种方式 拆分显示
sin_legend = ax.legend(handles=[sin], loc='upper right')
ax.add_artist(sin_legend)
ax.legend(handles=[cos], loc='lower right')
plt.show()
import numpy as np
import matplotlib.pyplot as plt
# 添加主题样式
plt.style.use('mystyle')
# 设置图的大小,添加子图
fig = plt.figure(figsize=(5,5))
ax = fig.add_subplot(111)
for color in ['red', 'green']:
n = 750
x, y = np.random.rand(2, n)
scale = 200.0 * np.random.rand(n)
ax.scatter(x, y, c=color, s=scale,
label=color, alpha=0.3,
edgecolors='none')
ax.legend()
ax.grid(True)
plt.show()
以上方法由办公区教程网编辑摘抄自百度经验可供大家参考!
标签: python
相关文章
- 详细阅读
-
python中关于单/双引号和转义引号的区别详细阅读
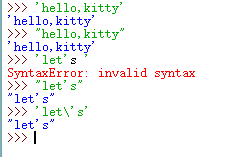
python中关于单/双引号和转义引号的区别,ytho中单/双引号的作用是将引号中间的符号以字符串的形式传递,而在ytho中它们两个的功能是一样的,只不过在遇到转义引号的时候,两者的使用才有所区别,现......
2023-03-16 321 python
- 详细阅读